Enterprise Analytics provides in-platform reporting on the organization's usage and spending. By enabling the Organization and Team Admins to view in-depth analytics, this empowers them to make data-driven decisions about allocation, resourcing and ROI.
If you already have access to Enterprise Analytics you can access it in the following ways:
-
Select this option on the menu bar on the left-hand side of the screen on ADAP:
-
Go to this link directly by pasting it on the URL bar of the browser: https://client.appen.com/analytics/dashboard
If you'd like to request access to this feature, please contact your Customer Success Manager or Account Executive.
Note: For Dedicated customers, this feature is currently not available On-Premises and only available via the cloud multi-tenant Appen Data Annotation Platform.
Enterprise Analytics consists of four different pages
- Overview
- User spend report
- Job insights
- Contributor Stats
Each of these pages presents a different set of information about the team or organization, with a date picker that can customize the timeframe to retrieve information.
Note: the Contributor Stats page is not date-specific, as it contains information for a single job).
Overview
The Overview page covers the following data points:
- Contributor Spend
- Activity Level
- Rows Finalized
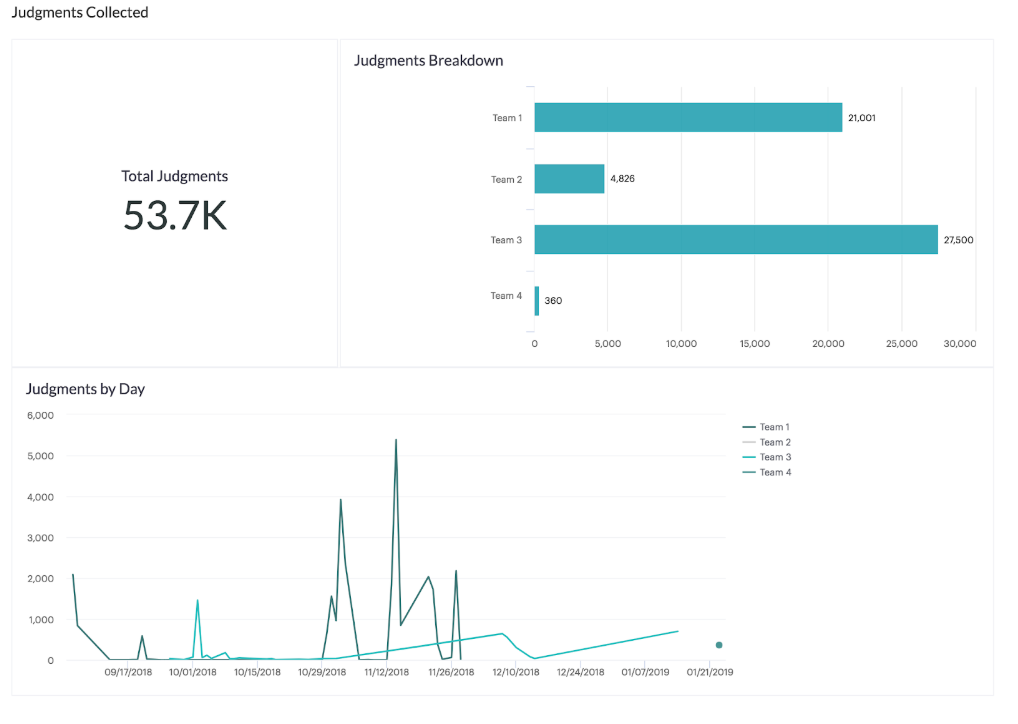
- Judgments Collected
Contributor Spend
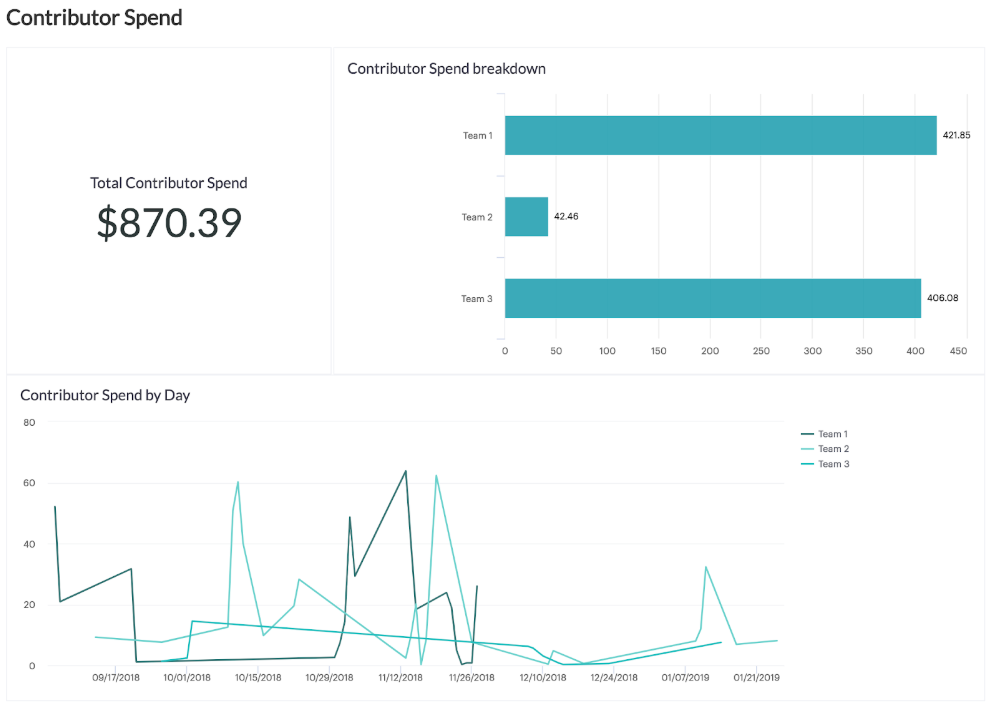
The contributor spends section shows the total amount an Organization or Team has paid contributors for working on its jobs over the given timeframe along with a line chart to show historical trends.
- Organization Admins have the ability to break this down by teams within their organization, or by projects the jobs are associated with.
- Team admin will only see this information for their own team, so the amount automatically broken down by the project. In addition to the breakdown, there is also a line chart to show historical trends.

Fig 1. Contributor Spend Page
Activity Level - Active Jobs
- The Rows Finalized section shows how many rows were finalized in the given timeframe
- Note: A row is finalized when it has collected the requested number of trusted judgments
Activity Level - Judgments collected
- The Judgments collected section shows how many judgments were submitted by contributors across all jobs and does not include test question judgments.

Fig 2. Judgments Collected Page
User Spend Report
- The User Spend Report covers how much team members have paid contributors over the given timeframe, along with their total lifetime spend
- Note: if a user has not spent any money on jobs over the given timeframe, they won't appear in the report even if they have a lifetime spend amount.

Fig 3. User Spend Report page
Job Insights
The Job Insights page provides a detailed breakdown of each job run over the chosen timeframe. It contains the following information per job:
- Title: this is the title of your job
- Job Owner: this is the email of the user who owns the job
- Cost Over Period: this is the amount paid to contributors over the given timeframe
- Status: Current state of the job
- Team: if you are a Team Admin, this will be the same for all jobs
- Project: the project in which the job is attached to
- Tags: A list of tags that were added to the job
- Total Cost: this is the total amount paid to contributors for the job over all time
- First Order: the date of the first order placed on the job (when the first set of rows was launched)
- Last Order: the date of the last order placed on the job. In jobs that have only one order, this will be the same as first order.
- Cost Per Row: this is the actual amount paid per finalized row, including costs for tainted judgments and test questions
- Total Rows: the number of rows uploaded to the job
- Launched Over Period and Total Launched Rows: the number of rows ordered over the given timeframe and the total number of rows ordered in the job for all time, respectively
- Finalized Rows Over Period and Total Finalized Rows: the number of rows finalized over the given timeframe, then the total number of rows finalized for all time, respectively
- Total Judgments Over Period: the total number of judgments over the given timeframe, including untrusted judgments, but not including test question judgments
- Trusted Judgments Over Period: the number of trusted judgments over the given timeframe, not including test question judgments
- Untrusted Judgments Over Period: the number of untrusted judgments over the given timeframe, not including test question judgments
- Total Judgments, Total Trusted Judgments, and Total Untrusted Judgments: the total number of each type of judgment for the job for all time

Fig 4. Job Insight page
Contributor Stats
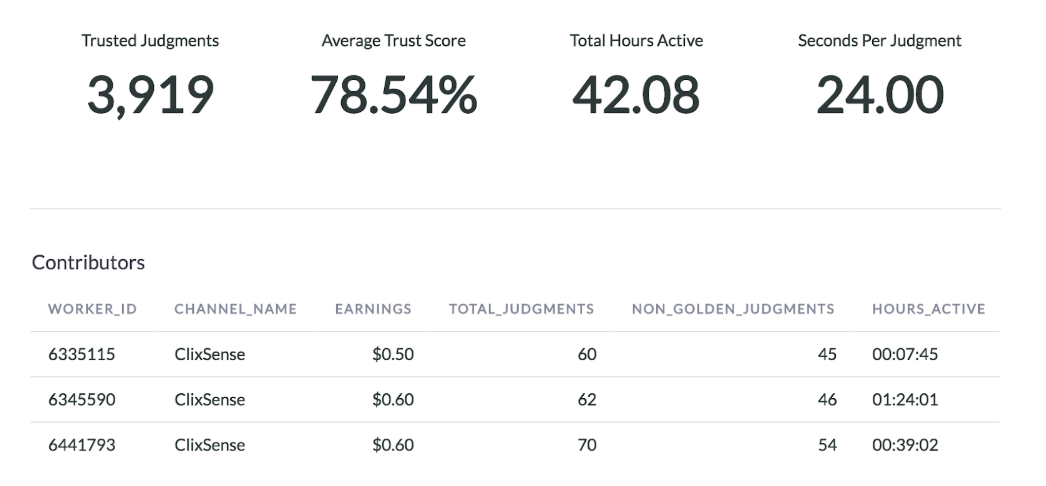
The Contributor Stats page on the job dashboard provides a detailed view of how contributors are performing in the job and the work they're doing. The information provided is as follows:
- Trusted Judgments: The total number of trusted judgments on non-test question rows
- Average Trust Score: The average test question accuracy of contributors in the job
- Total Hours Active: The cumulative amount of time contributors have spent working on the job. This is not just the amount of time the job has been running.
- Seconds per Trusted Judgment: This is the average time in seconds it takes contributors to judge a row of data.
- Contributor ID and Channel: The contributor's account ID and the channel they're working through
- Earning: How much money is in USD the contributor has earned working in the job
- Total Judgments: The number of judgments the contributor has submitted, excluding test questions
- Hours Active: The amount of time the contributor has spent working in the job
- Time per Judgment: the average time the contributor has taken to judge a row (in hours)
- TQ Accuracy: The contributor's test question accuracy in the job
- TQs seen: The number of test questions the contributor has judged
- Missed TQs: The number of test questions the contributor has answered incorrectly
- Forgiven Count: THe number of missed test questions the

Fig 5. Contributor Stats Page