

Note: High confidence rows are usually rows that are much simpler to enrich than the rest of the dataset. A test question set that is only made up of high confidence rows can lead to a lack of diversity in answer distributions and difficulty level.
We only recommend converting high confidence rows into test questions for a job that has been proven to provide quality results and already has a Test Question set with a range of difficulty and answer distributions. For some tools, this can now also be done via our Test Question conversion feature in the UI on finalized rows in a job. For more information on this, please visit this article.
You can learn more about Test Question best practices here.
Creating Test Questions out of High Confidence Rows
High confidence rows are data rows that have a high answer agreement, which is typically over 0.7 confidence. These rows can be used as Test Questions for a job because they provide an example of the type of data that fits the job’s instructions well. They can also demonstrate that contributors understand these types of rows best and have provided consistent answers. Using high confidence rows will also help cut down the amount of time needed to find good data to create Test Questions with.
Here is an overview to making high confidence rows into Test Questions:
- Download an aggregated report from a previously run or running job with finalized rows (do not include Test Questions)
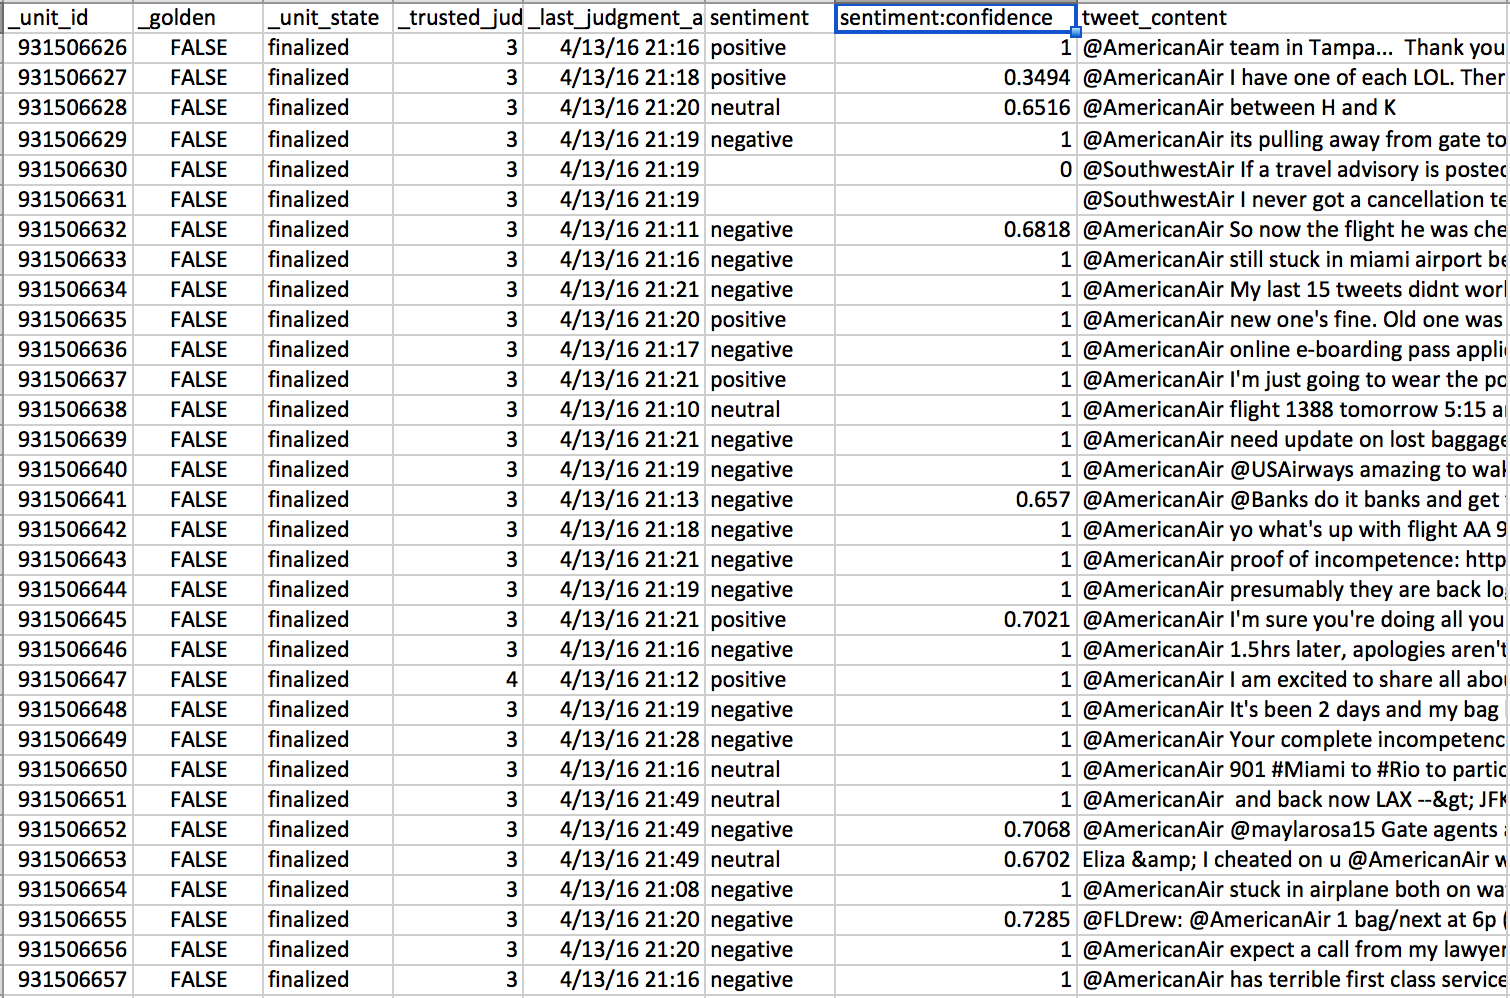
Fig. 1: Full aggregated report
- Sort out the aggregated report rows that have a confidence higher than 0.7 (or another number you find acceptable)
- Sort out the rows that have a confidence higher than 0.7 (or another number you find acceptable)
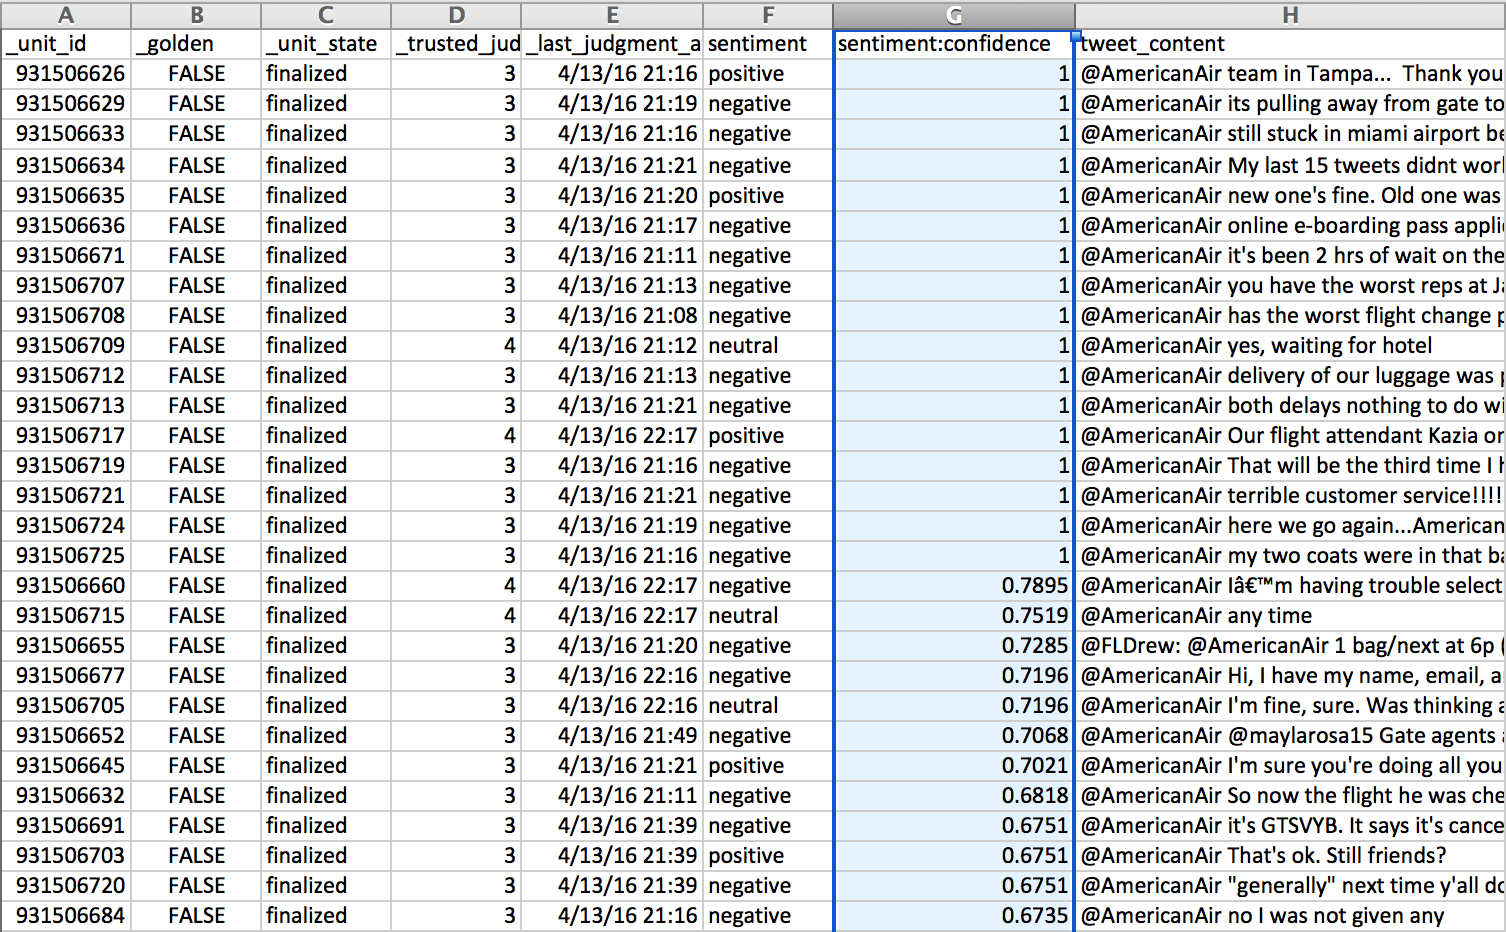
Fig. 2: Sort the fieldname:confidence column by descending order
- Reformat report
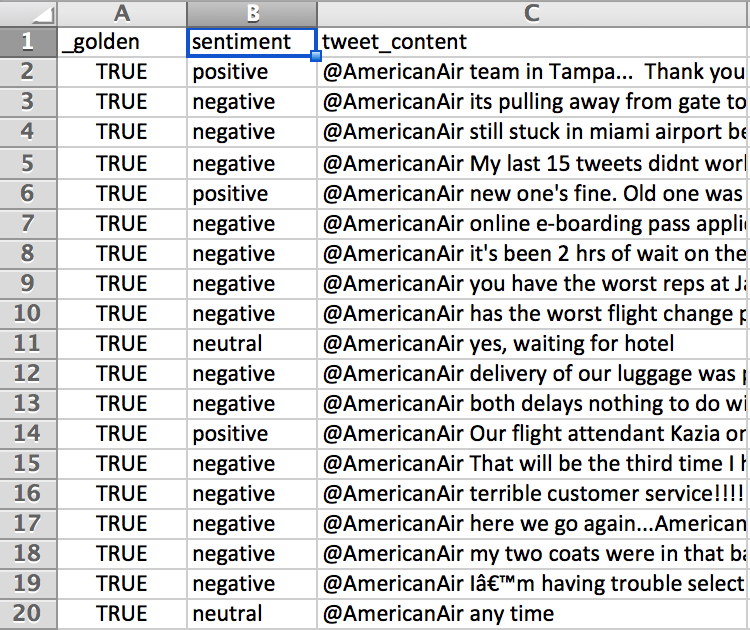
Fig. 3: Remove extraneous columns such as unit_id, unit_state, trusted_judgments, last_judgment_at, .confidence and update the _golden from ‘FALSE’ to ‘TRUE’
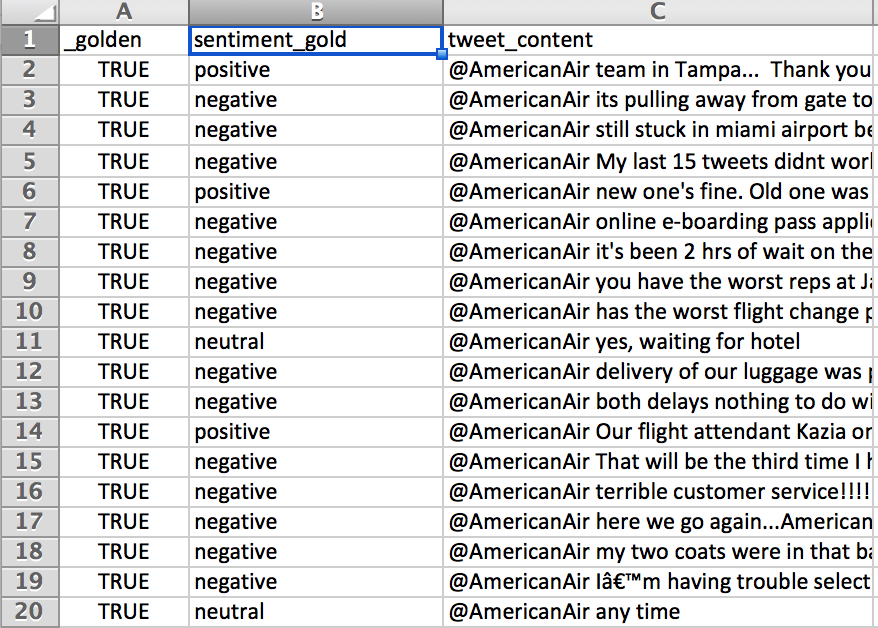
Fig. 4: Appended ‘_gold’ to the columns that will become the Test Question answers
Tip: Test Questions can also contain multiple correct answers in scenarios where the response of the contributor is more subjective than objective. When specifying Test Questions manually, multiple values in the Source Data will be determined by the newline character \n. Create this new line character with CMD+ENTER or CTRL+ENTER while editing the text cell in OpenOffice.
- Add Test Question reasons for each answer in each row of the report
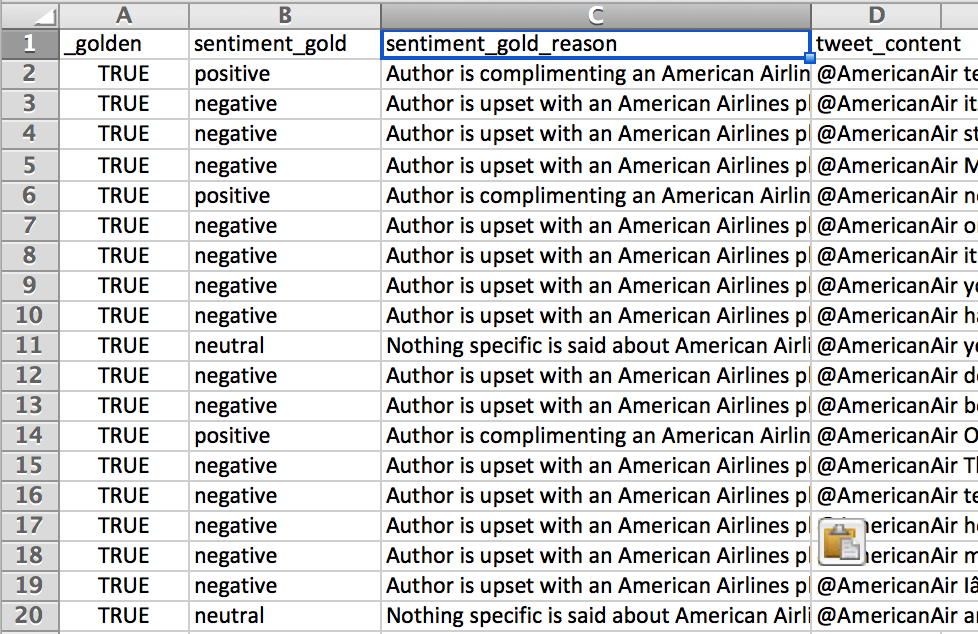
Fig. 5: Add a column ‘fieldname_gold_reason’ and define all reasons for the answer
Upload your Test Question Report via Source
- Go to the Data page within your job
- Select “Add More Data”
- A message may appear letting you know that your column headers do not match the data already uploaded to the job. Select ‘Proceed Anyways’ as we know this is a Test Question report and does not follow the data exactly
- Once your test questions have been added to your data page, click “Convert Uploaded Test Questions”
- Go to the Quality page to see your newly uploaded Test Questions
Creating an Even Answer Distribution in your Test Questions
Test Questions should have an appropriate answer distribution that reflects your dataset. An even answer distribution will train contributors on every possible answer instead of biasing them towards one answer.
However if your data set is skewed toward one type of answer (Ex: 95% or your data rows are equal to ‘Yes’ ) it could be time consuming to find rows that should be labeled differently (finding cases that are ‘No’ for instance). An efficient method for identifying disproportionate answers is to filter for them from an Aggregate report from a previously run job.
By following a similar strategy to the one outlined above, you could then convert these rows into test questions:
- Download the aggregate report from a similar previously run job
- Identify the question that needs a more even Test Question answer distribution
- Filter by the answer you want to create more Test Questions of
- Compile these selected rows into a Test Question report by following the steps above
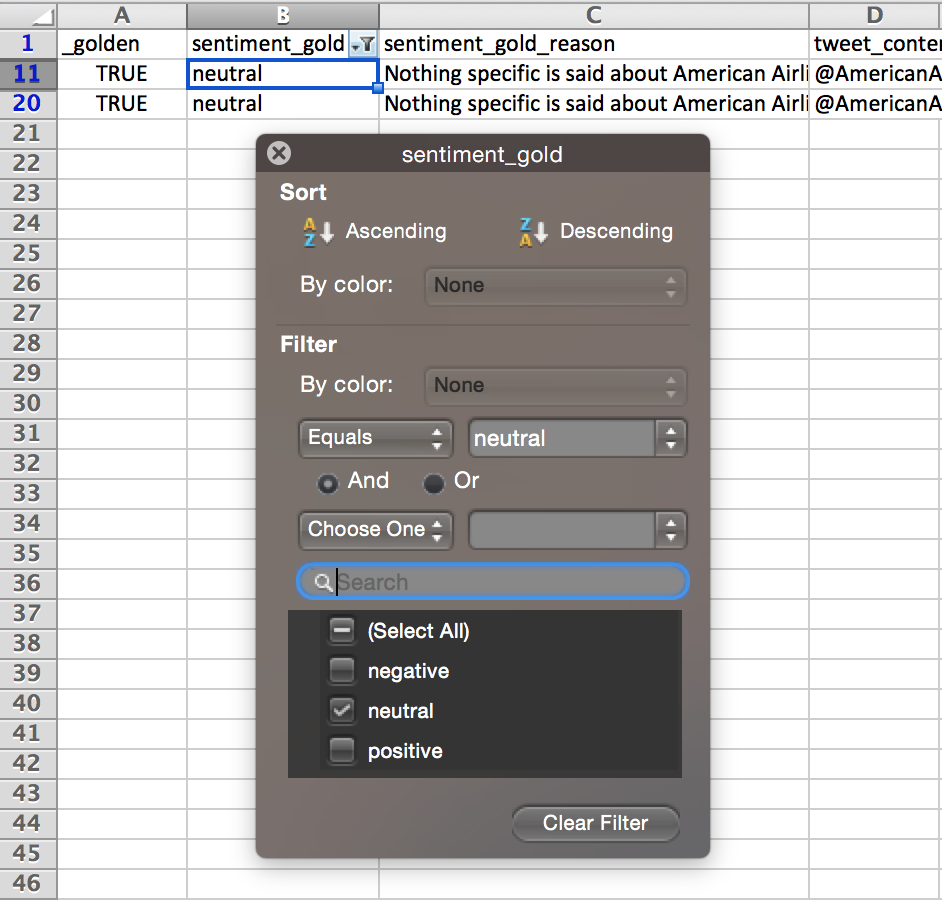
Fig. 6: ‘sentiment:confidence’ has been filtered to values greater than 0.7 in the steps above. Now a filter is applied to ‘sentiment_gold’, to show all ‘neutral’ answers as there are a very small percentage of the answer in the entire data set.