This page of the platform is used to take a deeper dive into performance data while job is live or after a job has run. Each section of the Advanced Analytics page is described in this article.
Contributors
Shows a histogram of the judgment counts for the top 100 contributors. Contributor ID, Judgments, and Trust are shown underneath the histogram.
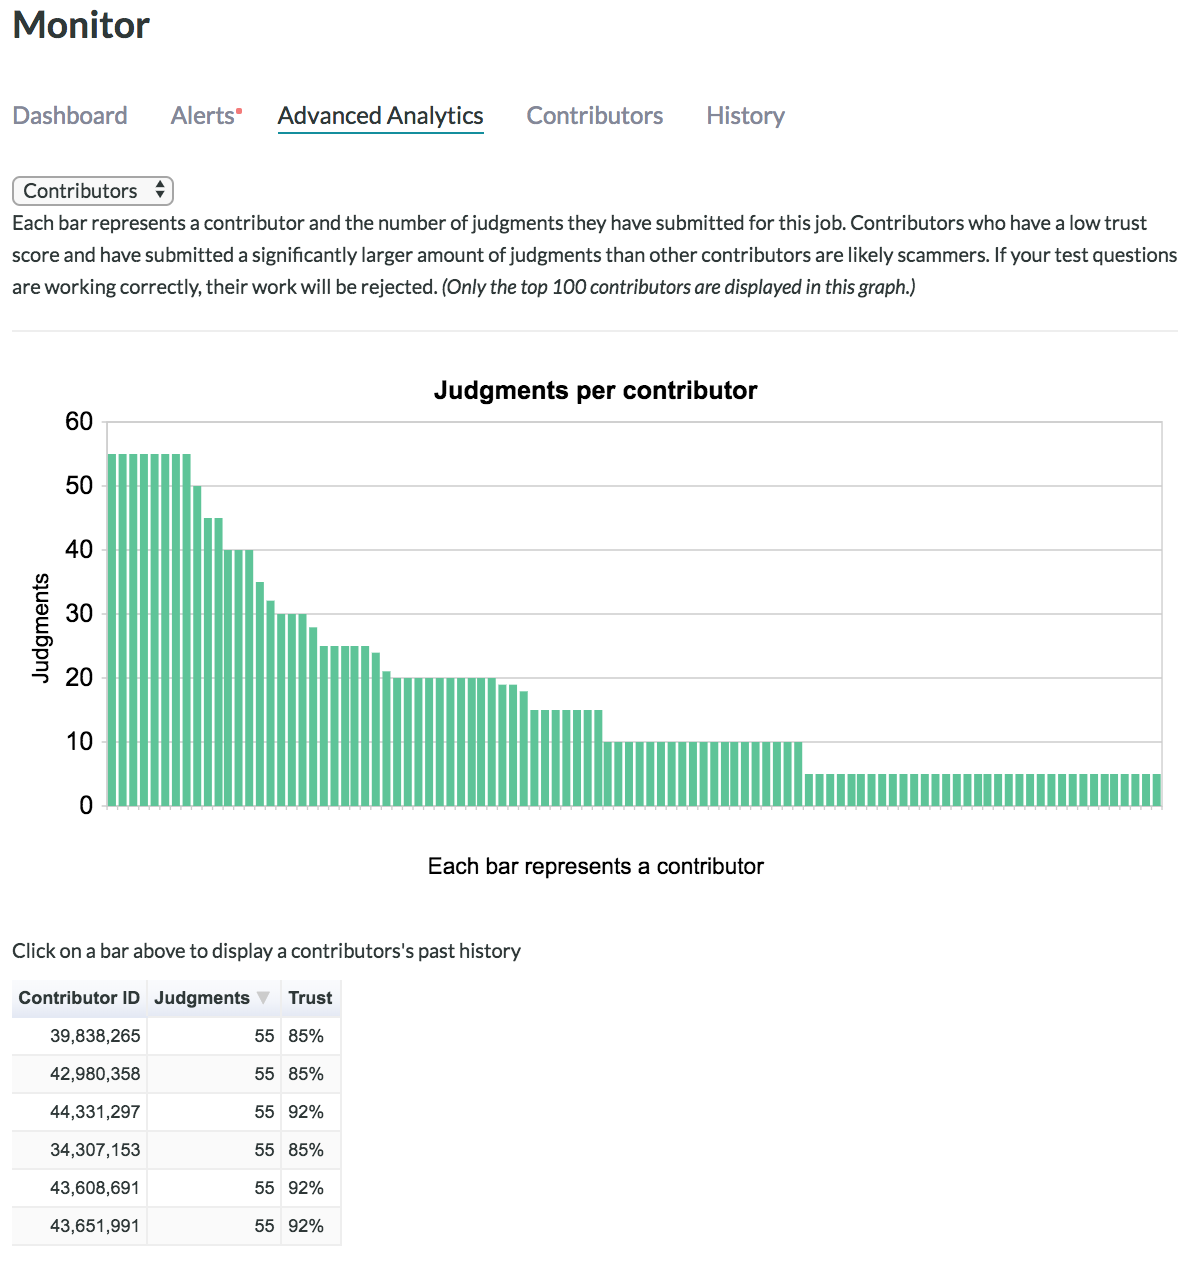
Fig. 1: Contributors Analytics Page
Note: Click a bar to get specific information on a contributor.
Quality
Shows the agreement on each form element of a job from a random sample of a 100 rows.
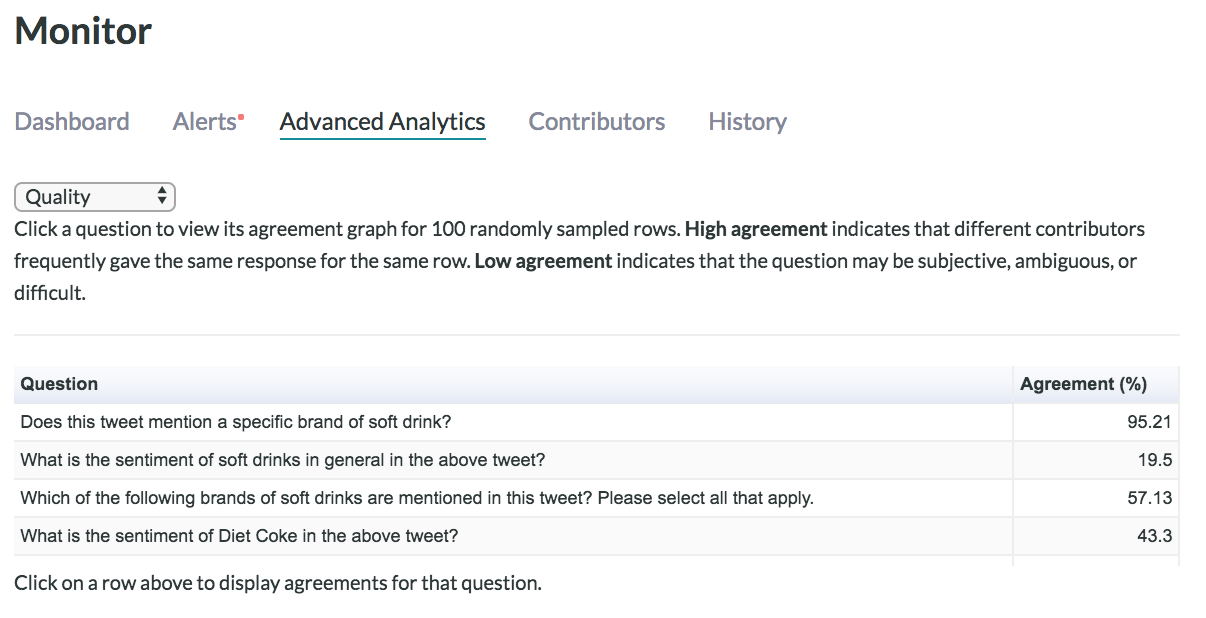
Fig. 2: Quality Analytics Page
Note: Click on form element name to see it’s histogram.
Distributions
Shows the answer distribution for a chosen form element. These distributions show all judgments given on the chosen form element.
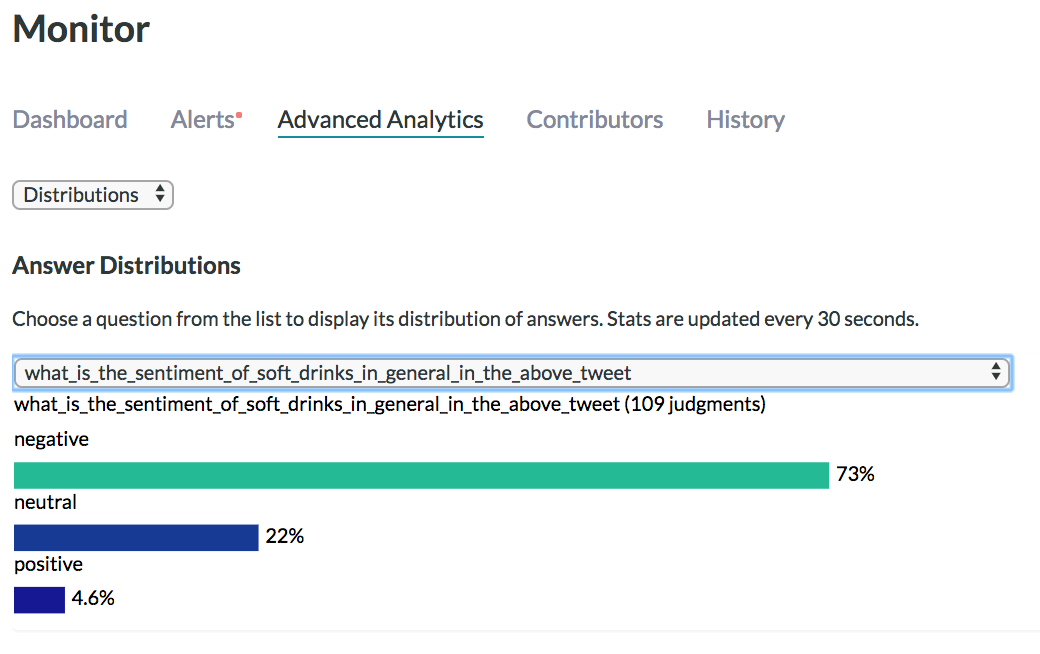
Fig. 3: Distributions Analytics Page
Times
Shows various metrics and details around times/throughput of a job. These include:
- Overall Rows Per Hour
- Estimated Time Left
- IQM (Interquartile Mean) Trusted Judgments
- IQM (Interquartile Mean) Untrusted Judgments
- IQM (Interquartile Mean) Page Time by Trusted Contributors
- IQM (Interquartile Mean) Page Time by Untrusted Contributors
- Trusted Judgments By Hour
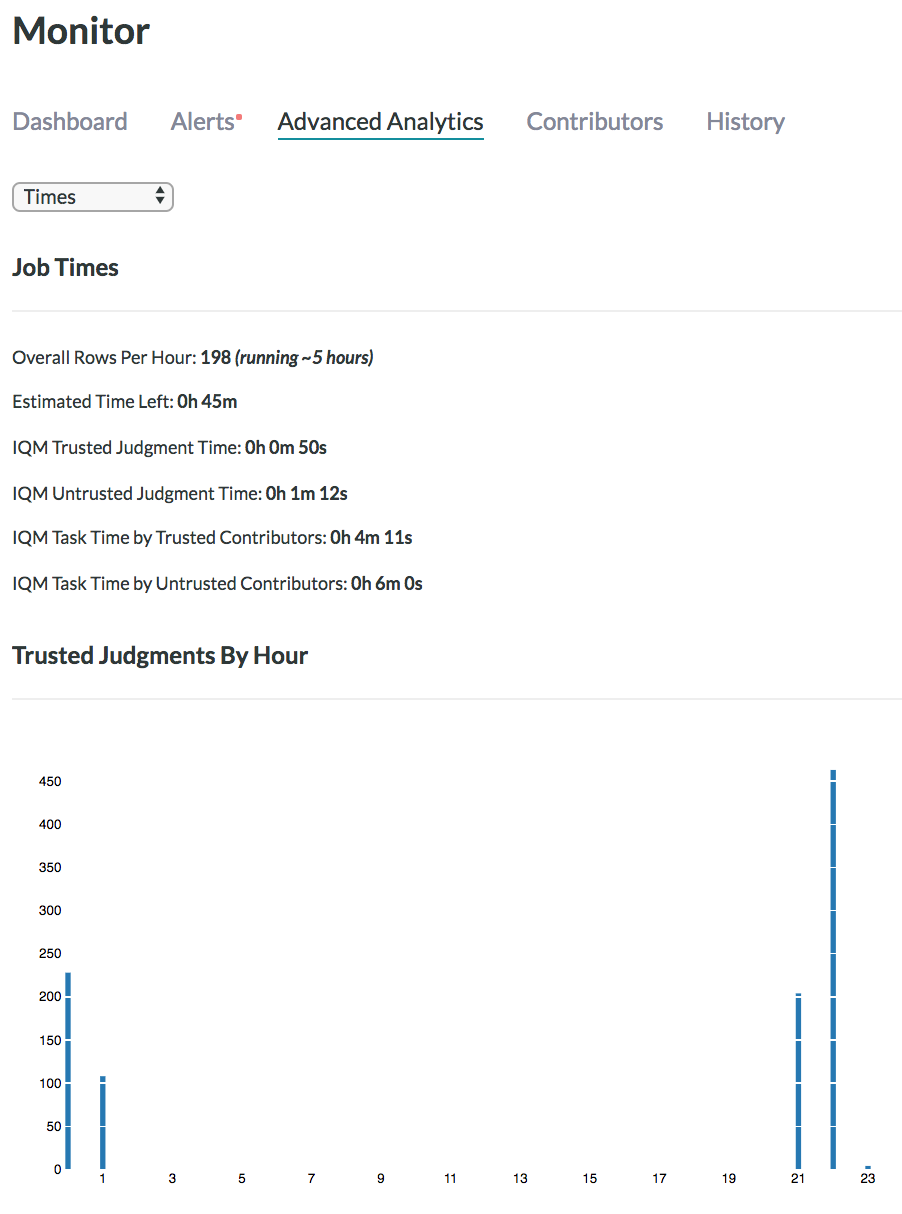
Fig. 4: Times Analytics Page
Test Questions
Shows accuracy on Test Questions for up to 50 Test Questions in a job. Performance from Trusted, Untrusted, and All contributors are shown on this page.
A Percent Correct on Test Questions graph is shown to help identify the Test Questions with the lowest accuracy that need review.
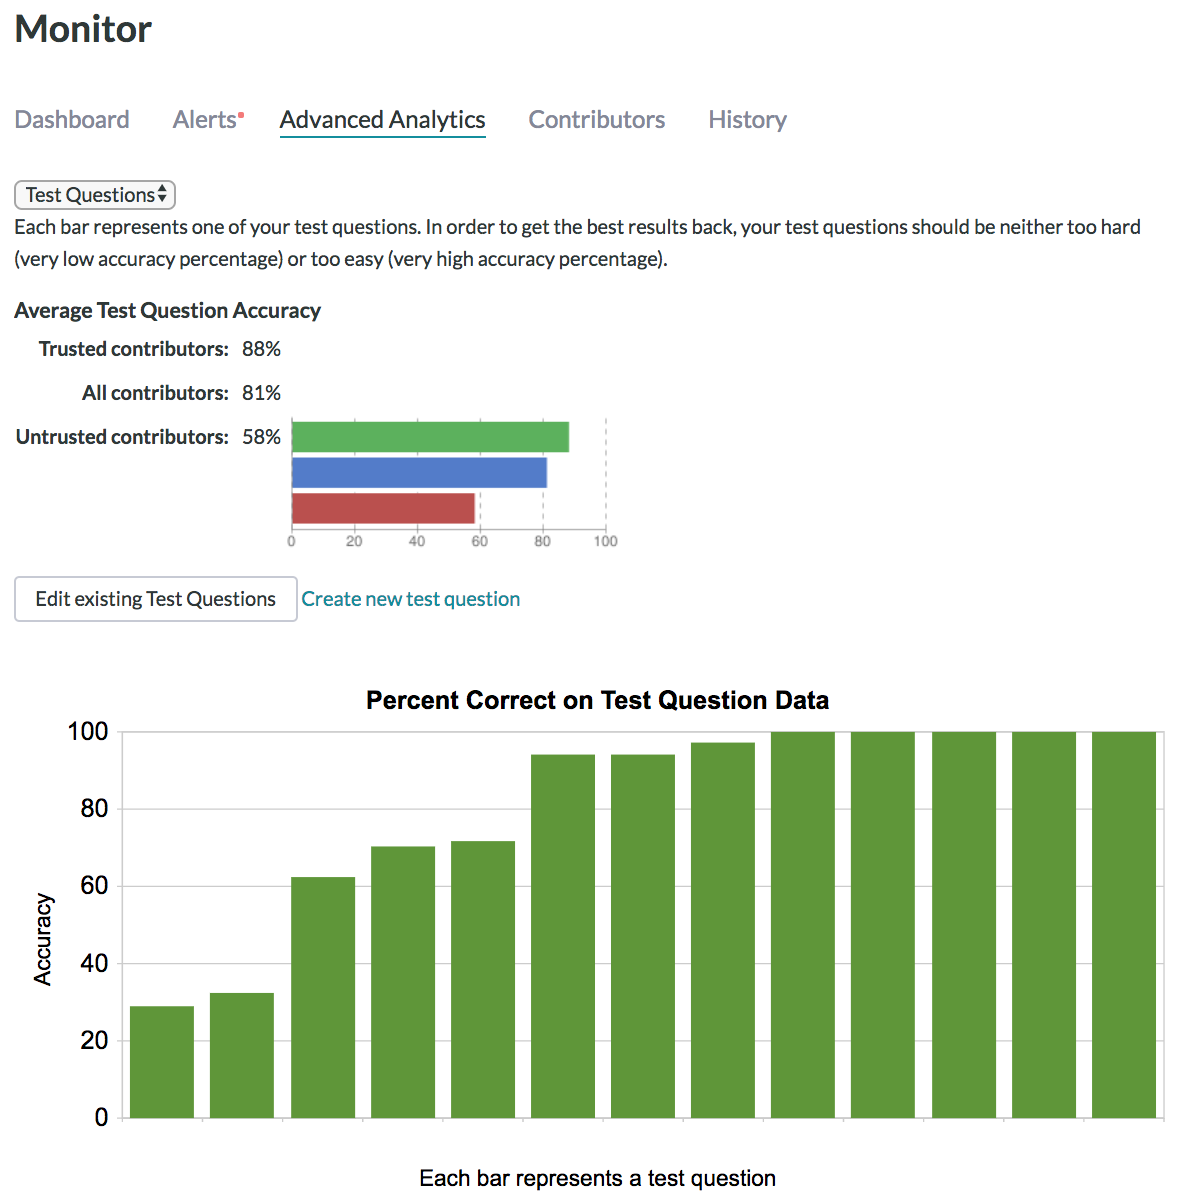
Fig. 5: Test Questions Analytics Page
Costs
Shows various metrics and details around job costs. This includes:
- Contributor Pay Per Page
- Contributor Pay Per Judgment
- Hourly Compensation
- Cost Per Row
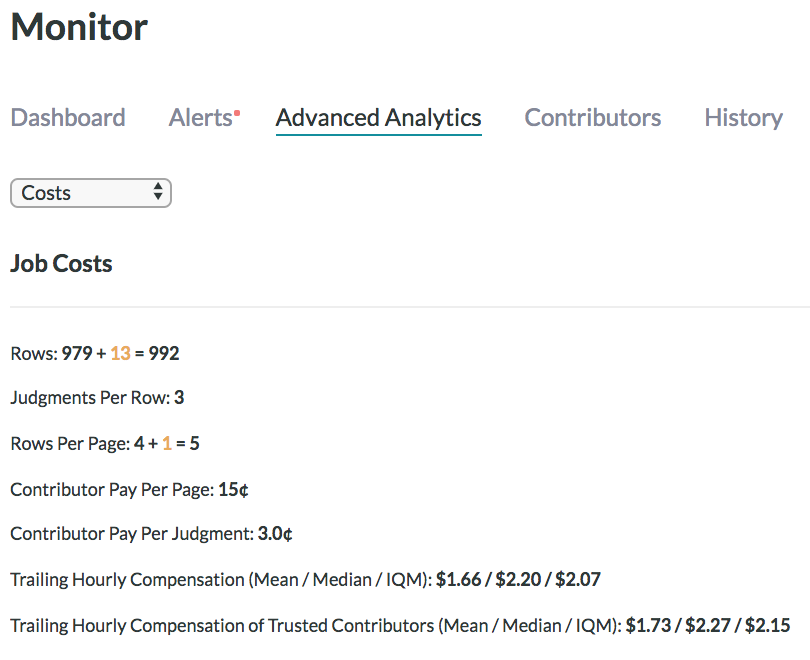
Fig. 6: Costs Analytics Page
Channels
Shows information on the total judgments completed by each channel. This also shows ratio of Trusted to Untrusted Judgments per channel.
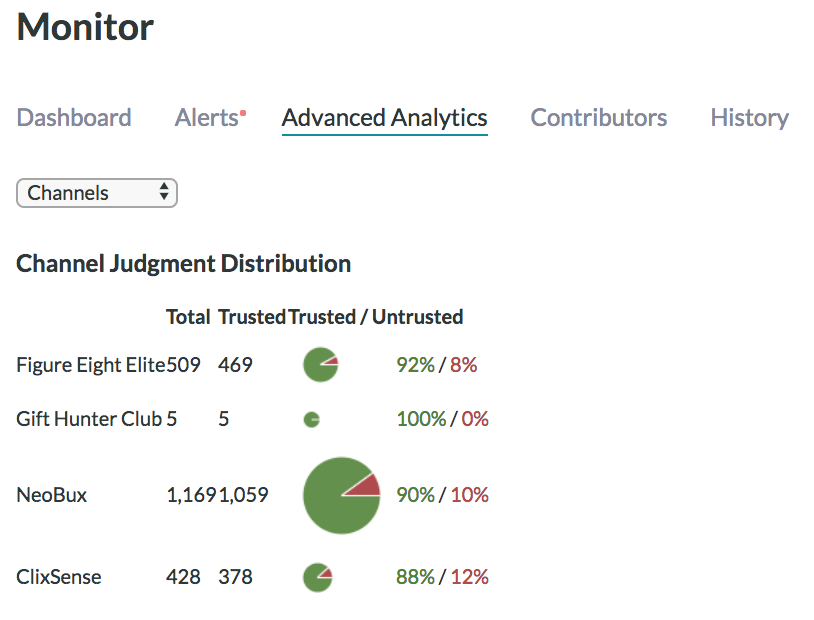
Fig. 7: Channels Analytics Page